Community Budget Survey Results
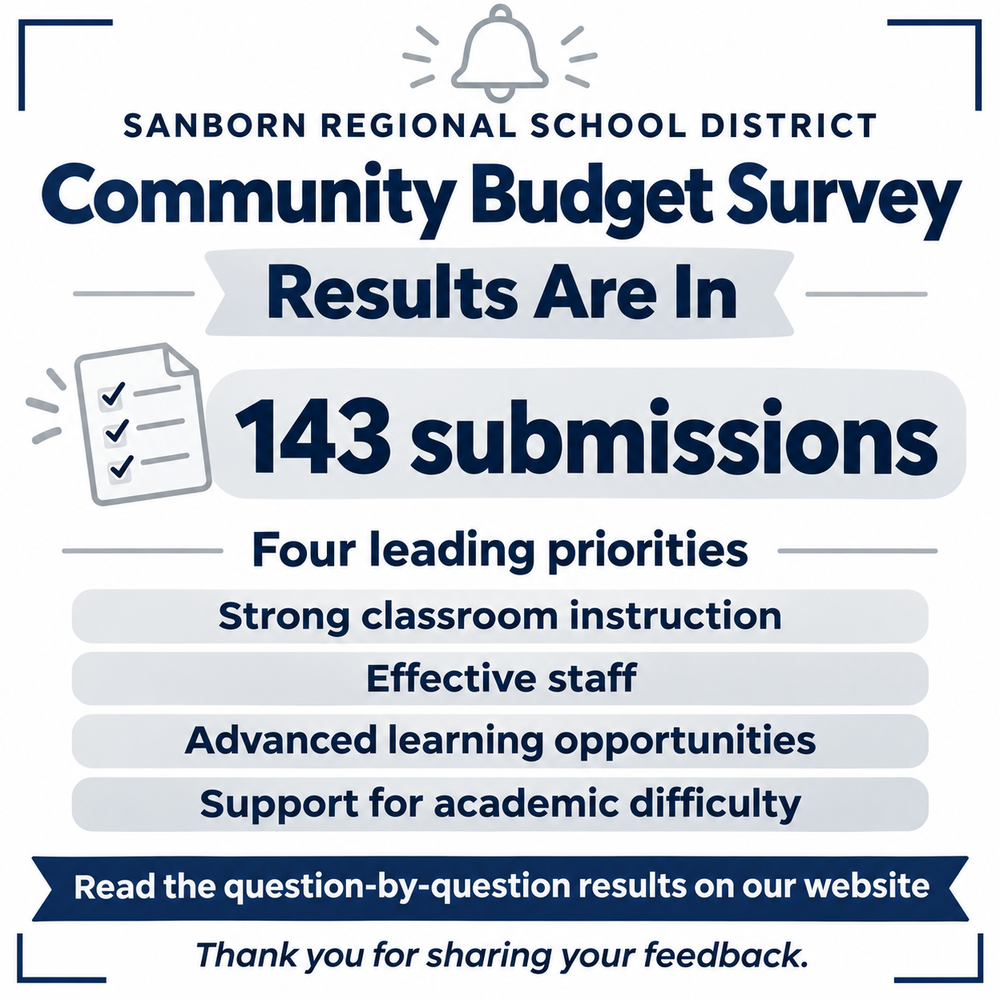
Thank you to everyone who contributed to Sanborn’s Community Budget Survey. The final results include 143 submissions about educational priorities, District programs, budget considerations, and opportunities for improvement.
The results below review each survey question. Written comments are summarized without quotations, names, individual circumstances, or other identifying details. Demographic information is reported separately from opinions and comments.
Understanding the results
The survey was anonymous and voluntary, and multiple submissions were possible. Results describe submissions rather than verified individual participants and should not be interpreted as representing every District resident.
Unless otherwise noted, percentages use all 143 submissions. Each rating table includes every response, with related response options combined as explained below. Percentages may not total exactly 100% because of rounding. Some topic labels are shortened for readability.
The final totals include two submissions received before the public launch that were not identified as test entries. Excluding those submissions does not change the order of the four leading budget priorities.
Question 1 — Where do you live?
Community | Submissions | Percentage |
|---|---|---|
Kingston | 99 | 69.2% |
Newton | 38 | 26.6% |
Another community | 6 | 4.2% |
Question 2 — What is your connection to the District?
Participants could select more than one connection. These categories overlap, so their counts and percentages should not be added together.
Connection | Submissions | Percentage |
|---|---|---|
Parent or guardian of a current Sanborn student | 102 | 71.3% |
Resident without a student currently attending Sanborn | 30 | 21.0% |
Former Sanborn student or graduate | 14 | 9.8% |
District employee | 10 | 7.0% |
Local business owner | 10 | 7.0% |
Small categories and individually described affiliations are not separately reported to protect privacy.
Question 3 — How familiar are you with the District’s current programs and services?
Familiarity | Submissions | Percentage |
|---|---|---|
Very familiar | 38 | 26.6% |
Somewhat familiar | 64 | 44.8% |
Slightly familiar | 29 | 20.3% |
Not familiar | 12 | 8.4% |
Participants brought different levels of familiarity to the survey. This context matters when interpreting both program ratings and requests for additional information.
Question 4 — How much emphasis should the District place on each student outcome?
Participants rated each outcome independently. High emphasis below combines “High emphasis” and “Very high emphasis.” Each cell shows the number of submissions and percentage of all submissions.
Student outcome | High emphasis | Moderate emphasis | Limited emphasis | Need more information |
|---|---|---|---|---|
Foundational reading, writing, and mathematics | 136 (95.1%) | 7 (4.9%) | 0 (0.0%) | 0 (0.0%) |
Critical thinking, problem-solving, and applying learning | 137 (95.8%) | 5 (3.5%) | 0 (0.0%) | 1 (0.7%) |
Academic growth for every student | 125 (87.4%) | 13 (9.1%) | 3 (2.1%) | 2 (1.4%) |
Support for students experiencing academic difficulty | 120 (83.9%) | 15 (10.5%) | 5 (3.5%) | 3 (2.1%) |
Deeper learning, extension, and appropriate acceleration | 118 (82.5%) | 17 (11.9%) | 5 (3.5%) | 3 (2.1%) |
Preparation for college, careers, military service, and adult life | 132 (92.3%) | 8 (5.6%) | 1 (0.7%) | 2 (1.4%) |
Communication, collaboration, creativity, and transferable skills | 114 (79.7%) | 23 (16.1%) | 4 (2.8%) | 2 (1.4%) |
Student safety, belonging, and emotional well-being | 112 (78.3%) | 21 (14.7%) | 9 (6.3%) | 1 (0.7%) |
Arts, athletics, clubs, and experiences beyond the classroom | 105 (73.4%) | 27 (18.9%) | 11 (7.7%) | 0 (0.0%) |
Responsible citizenship and connection to Kingston and Newton | 94 (65.7%) | 39 (27.3%) | 8 (5.6%) | 2 (1.4%) |
Critical thinking, foundational academic skills, and preparation for adult life received the strongest combined high-emphasis ratings. Every listed outcome received high-emphasis ratings in a majority of submissions.
Question 5 — How much priority should each area receive in the FY 2028 budget?
Participants rated each area independently. High priority combines “High priority” and “Highest priority for budget consideration.” Lower or no additional investment priority combines “Lower priority” and “Not a priority for additional investment at this time.”
Budget area | High priority | Moderate priority | Lower or no additional investment priority | Need more information |
|---|---|---|---|---|
Classroom instruction quality and consistency | 132 (92.3%) | 10 (7.0%) | 1 (0.7%) | 0 (0.0%) |
Academic intervention and additional student support | 104 (72.7%) | 26 (18.2%) | 11 (7.7%) | 2 (1.4%) |
Advanced learning opportunities | 109 (76.2%) | 22 (15.4%) | 12 (8.4%) | 0 (0.0%) |
Special education and inclusive learning opportunities | 95 (66.4%) | 30 (21.0%) | 16 (11.2%) | 2 (1.4%) |
Mental health, behavioral, and wellness supports | 103 (72.0%) | 22 (15.4%) | 17 (11.9%) | 1 (0.7%) |
Arts, music, library media, athletics, clubs, and other opportunities | 106 (74.1%) | 20 (14.0%) | 17 (11.9%) | 0 (0.0%) |
Recruiting, retaining, and developing effective staff | 113 (79.0%) | 15 (10.5%) | 13 (9.1%) | 2 (1.4%) |
Coordination between schools and grade levels | 76 (53.1%) | 43 (30.1%) | 21 (14.7%) | 3 (2.1%) |
Safe, functional, and welcoming facilities | 104 (72.7%) | 26 (18.2%) | 10 (7.0%) | 3 (2.1%) |
Family communication and engagement | 94 (65.7%) | 34 (23.8%) | 15 (10.5%) | 0 (0.0%) |
Community and local business partnerships | 68 (47.6%) | 49 (34.3%) | 23 (16.1%) | 3 (2.1%) |
Responsible and efficient District operations | 115 (80.4%) | 19 (13.3%) | 6 (4.2%) | 3 (2.1%) |
Classroom instruction, responsible operations, and effective staff received the strongest combined high-priority ratings. These responses identify areas for budget attention; they do not specify funding amounts or necessarily call for increased spending.
Question 6 — What considerations should guide decisions about programs, services, staffing, and investments?
Substantial weight below combines “Considerable weight” and “Great weight.”
Decision consideration | Substantial weight | Some weight | Limited weight | Need more information |
|---|---|---|---|---|
Direct effect on student learning | 141 (98.6%) | 2 (1.4%) | 0 (0.0%) | 0 (0.0%) |
Student safety and well-being | 130 (90.9%) | 7 (4.9%) | 4 (2.8%) | 2 (1.4%) |
Evidence that a program or approach is effective | 126 (88.1%) | 13 (9.1%) | 2 (1.4%) | 2 (1.4%) |
Responsiveness to identified student needs | 124 (86.7%) | 13 (9.1%) | 3 (2.1%) | 3 (2.1%) |
Number of students served | 95 (66.4%) | 38 (26.6%) | 6 (4.2%) | 4 (2.8%) |
Fair and consistent access across schools and grades | 105 (73.4%) | 30 (21.0%) | 4 (2.8%) | 4 (2.8%) |
Continuity between grades and schools | 97 (67.8%) | 32 (22.4%) | 11 (7.7%) | 3 (2.1%) |
Availability of another way to meet the same need | 90 (62.9%) | 34 (23.8%) | 10 (7.0%) | 9 (6.3%) |
Ability to recruit and retain qualified staff | 127 (88.8%) | 10 (7.0%) | 4 (2.8%) | 2 (1.4%) |
Long-term sustainability | 124 (86.7%) | 13 (9.1%) | 2 (1.4%) | 4 (2.8%) |
Responsible use of public resources | 128 (89.5%) | 13 (9.1%) | 2 (1.4%) | 0 (0.0%) |
Alignment with District goals and educational priorities | 110 (76.9%) | 21 (14.7%) | 5 (3.5%) | 7 (4.9%) |
The direct effect on student learning received the strongest response. Safety, responsible spending, staff quality, evidence of effectiveness, responsiveness to needs, and sustainability also received substantial weight.
Question 7 — Which three areas should receive the greatest attention during the FY 2028 budget process?
Each submission selected three distinct priorities. The results combine those selections without assigning different weights to their order.
Priority | Submissions | Percentage |
|---|---|---|
Strengthening core academic instruction | 111 | 77.6% |
Recruiting, retaining, and developing effective staff | 79 | 55.2% |
Expanding advanced, extended, and accelerated learning | 74 | 51.7% |
Supporting students experiencing academic difficulty | 63 | 44.1% |
Expanding arts, athletics, clubs, and other student opportunities | 30 | 21.0% |
Strengthening student well-being and belonging | 29 | 20.3% |
Improving operational efficiency and responsible stewardship | 18 | 12.6% |
Maintaining and improving school facilities | 14 | 9.8% |
Strengthening family and community engagement | 8 | 5.6% |
Improving transitions and consistency across schools | 3 | 2.1% |
There were 429 selections, three per submission. Percentages therefore total approximately 300%.
This question required participants to narrow their choices. A lower placement does not establish that an area is unimportant or that participants support reducing it. For example, facilities and responsible operations received considerably broader support when rated independently in Question 5.
Question 8 — How useful would additional District information be?
More information useful combines “Very useful—more information is needed” and “Somewhat useful—more information would help.” The other response categories are shown separately.
Information topic | More information useful | Current information sufficient | Low priority for additional communication | Unsure |
|---|---|---|---|---|
Student achievement and academic growth | 108 (75.5%) | 29 (20.3%) | 2 (1.4%) | 4 (2.8%) |
Curriculum and classroom instruction | 106 (74.1%) | 28 (19.6%) | 3 (2.1%) | 6 (4.2%) |
Academic intervention and student support | 95 (66.4%) | 29 (20.3%) | 10 (7.0%) | 9 (6.3%) |
Enrichment and advanced learning | 100 (69.9%) | 29 (20.3%) | 7 (4.9%) | 7 (4.9%) |
Special education and student services | 86 (60.1%) | 29 (20.3%) | 16 (11.2%) | 12 (8.4%) |
Class sizes, enrollment, and staffing | 97 (67.8%) | 28 (19.6%) | 12 (8.4%) | 6 (4.2%) |
Arts, athletics, clubs, and student activities | 94 (65.7%) | 29 (20.3%) | 16 (11.2%) | 4 (2.8%) |
Facilities and long-range planning | 115 (80.4%) | 21 (14.7%) | 4 (2.8%) | 3 (2.1%) |
District finances and use of public resources | 124 (86.7%) | 13 (9.1%) | 3 (2.1%) | 3 (2.1%) |
School Board decisions and upcoming discussions | 116 (81.1%) | 21 (14.7%) | 3 (2.1%) | 3 (2.1%) |
Opportunities for family and community participation | 103 (72.0%) | 33 (23.1%) | 5 (3.5%) | 2 (1.4%) |
Additional information about finances, Board decisions, and facilities planning drew the strongest combined interest. A majority of submissions indicated that more information would be useful in every listed area.
About the written-response summaries
The following four questions were optional. Across them, 109 submissions included at least one written entry. Entry counts include brief responses such as uncertainty or “not applicable.”
The summaries describe themes and differing views. They are not frequency rankings, verified findings, or statements of agreement by all participants. Individual examples, personal histories, and direct quotations have been omitted.
Question 9 — What existing strength should be preserved or built upon?
87 submissions included an entry.
Themes included:
Dedicated staff and relationships. Participants valued caring teachers, experienced employees, individual attention, and staff members who know students well.
Small-school community and pride. Comments identified personal connections, community involvement, and school traditions as strengths.
Academic instruction and student support. Participants recognized literacy instruction, academic progress, inclusive practices, and attention to individual learning needs.
Opportunities beyond core classes. Arts, music, athletics, clubs, career experiences, and advanced learning options were identified as valuable.
Communication and facilities. Some comments recognized newsletters, improved communication, welcoming spaces, and maintained grounds and buildings.
Not all entries identified a strength. Some expressed uncertainty or dissatisfaction with spending, academic opportunities, or District performance.
Question 10 — Where should the District most improve the experience of students or families?
93 submissions included an entry.
Themes included:
Clearer, more consistent communication. Participants requested easier access to assignments, student progress, services, and timely responses to concerns.
Stronger instruction and appropriate challenge. Comments called for academic expectations, consistent curriculum, stronger foundational skills, and enrichment for students ready to move beyond grade-level work.
Reliable academic and special education support. Participants raised concerns about access, early identification, consistency, and communication with families.
Staff and leadership stability. Comments emphasized qualified hiring, retention, manageable workloads, and continuity.
Safety, behavior, and well-being. Participants requested attention to bullying concerns, respectful behavior, inclusion, and mental health.
Family engagement and daily logistics. Suggestions addressed cross-school coordination, transportation, schedules, activities, and opportunities for families to participate.
Financial transparency. Comments requested clearer explanations of spending and its relationship to student outcomes.
Some entries expressed satisfaction or recognized recent improvement. Views also differed about curriculum, technology use, and staffing needs.
Question 11 — What opportunity should Sanborn explore that it is not providing consistently?
83 submissions included an entry.
Suggestions included:
More consistent enrichment, acceleration, advanced coursework, and academic competitions.
Career and technical pathways, internships, job shadowing, business partnerships, and practical life skills.
Broader access to arts, athletics, clubs, field experiences, and activities for younger students.
Community service, volunteer involvement, and stronger connections between schools and residents.
Expanded academic, behavioral, and mental health support.
Partnerships with other districts and colleges to broaden student opportunities and staff learning.
Reviews of instructional approaches, technology use, schedules, and outdoor time.
Shared services, alternative funding, and clearer financial comparisons.
Some participants were unsure what to suggest. Inclusion here does not establish that a service is absent; a suggestion may also indicate a need for clearer information about existing opportunities.
Question 12 — What else should District leaders consider when developing the FY 2028 budget?
80 submissions included an entry.
Comments reflected several perspectives:
Affordability and spending restraint. Some participants requested a flat or reduced budget, limited tax increases, lower administrative costs, and staffing aligned with enrollment.
Protecting educational quality. Others supported investment in effective staff, student support, academic challenge, and opportunities that could be weakened by reductions.
Staff retention and working conditions. Comments emphasized competitive compensation, adequate support, and the consequences of turnover or increased workloads.
Long-term planning. Participants asked for sustainable decisions, facilities maintenance, clear priorities, and consideration of future needs.
Alternative approaches and funding. Suggestions included partnerships, shared services, grants, regional opportunities, and state support.
Transparency and community involvement. Participants requested understandable spending information, explanations of tax effects, evidence of results, and opportunities to offer input before decisions.
Student readiness and well-being. Comments emphasized strong academics, practical skills, safety, belonging, and preparation for life after school.
Views differed about the appropriate spending level, allocation of resources, facilities investment, and the tax-cap proposal. The survey does not establish community agreement on those decisions.
How the results will inform budget planning
The feedback will help frame questions and examine options during FY 2028 budget development. It will be considered alongside verified enrollment, staffing, student achievement, program participation, financial information, and required services.
The survey identifies priorities and ideas for examination. It does not determine funding amounts, authorize new programs, or establish support for particular reductions.
Thank you for contributing to this discussion and helping the District understand the range of priorities and concerns within our community.